


Capgemini delivers a solid Q3 performance with growth of +2.3% at constant exchange rates
- Revenues of €5,480 million in Q3 2023, up +2.3% at constant exchange rates*
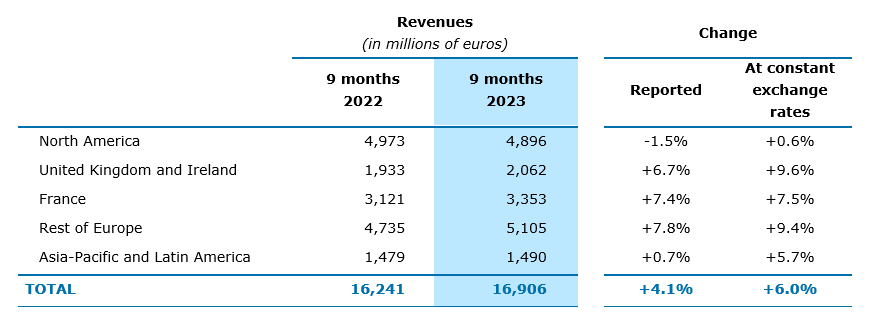
- Revenues of €16,906 million in the first nine months, up +6.0% at constant exchange rates
Paris, November 7, 2023 – The Capgemini Group reported consolidated revenues of €5,480 million in Q3 2023, down -1.3% at current exchange rates and up +2.3% at constant exchange rates* year-on-year.
Aiman Ezzat, Chief Executive Officer of the Capgemini Group, commented: “The Group delivered a solid performance in the third quarter in a challenging economic environment.
Q3 2023
Carole Ferrand, CFO, comments on Capgemini’s Q3 2023 revenues
The dual transition to a digital and sustainable economy continues to be at the top of our clients’ strategic agendas. Their appetite for technology has never been greater, fueled by constant innovation such as generative AI and the proliferation of its use cases to drive growth, deliver new services and optimize operations. Demand for generative AI accelerated in the third quarter with over 100 projects signed and a strong pipeline. As part of our 2 billion euros investment plan announced in July, we launched our Gen AI campus to scale up training for all our employees.
We have become a major business and technology partner to our clients across their entire value chains playing a significant role from product innovation to customer interactions and services. Our portfolio of industry-specific innovative offerings meets client demand for value-creating solutions and contributes to our sustained operating margin improvement.
Thanks to this third-quarter performance, we confirm all our full-year objectives.”
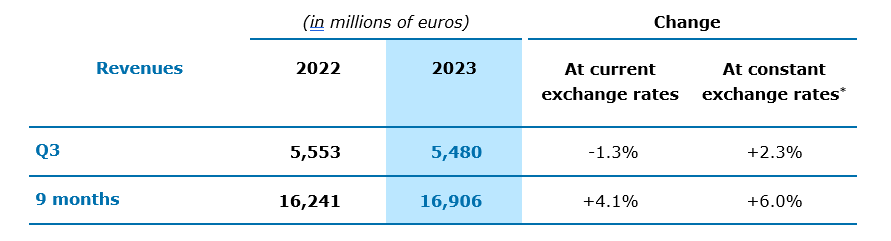
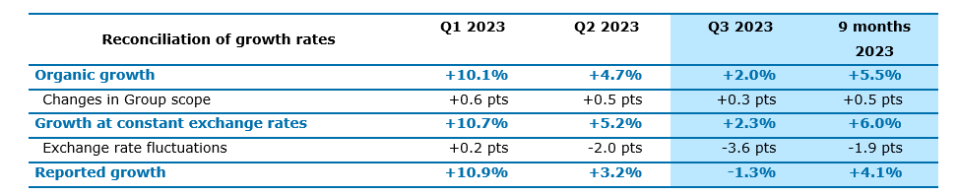
Capgemini’s performance in Q3 2023 was a prolongation of the trends observed since the start of the year, extending as expected the gradual slowdown seen in previous quarters. The Group posted revenues of €5,480 million in Q3, up +2.3% at constant exchange rates. Organic growth* i.e., excluding the impacts of currency fluctuations and changes in Group scope, is +2.0% for the quarter. For the first nine months of the year, growth stands at +4.1% on a reported basis and +6.0% at constant exchange rates, while organic growth reaches +5.5%.
In a macroeconomic context that remains challenging, clients are holding onto their digital transformation ambitions. They are increasingly focusing on projects with faster payback, such as those boosting operational efficiency, which in turn fuels steady growth of the Group’s innovative offers. The Group’s activities involving Data and Artificial Intelligence and those in Intelligent Industry were the fastest growing in Q3.
OPERATIONS BY REGION
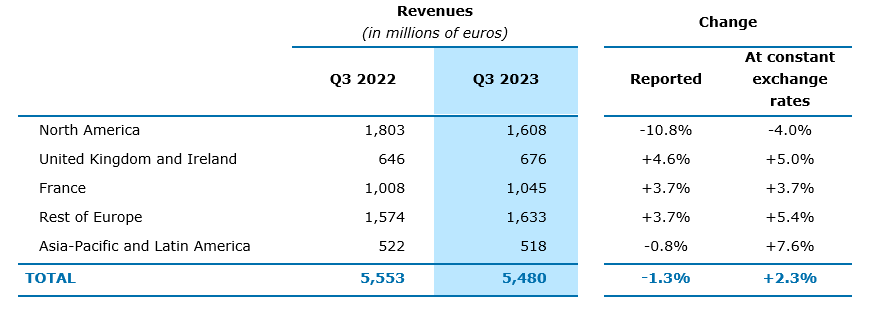
Overall, the contrast in growth rates between regions is unchanged since the beginning of the year.
The United Kingdom and Ireland region (12% of Group revenues in Q3 2023) continued its solid momentum, growing +5.0% at constant exchange rates. This performance was primarily driven by the strong growth in the Public Sector and the Consumer Goods & Retail Sector, while the Financial Services and TMT (Telecoms, Media and Technology) sectors were down.
The Rest of Europe region (30% of Group revenues) also performed well with growth of +5.4% at constant exchange rates, primarily fueled by the Public Sector and the Manufacturing, Energy and Utilities sectors.
France revenues (19% of Group revenues) were up by +3.7% at constant exchange rates. The momentum recorded in the Public Sector and the solid performance delivered by the Consumer Goods & Retail and Manufacturing sectors contrasted with the decline in TMT.
Revenues in the North America region (29% of Group revenues) were down by -4.0% at constant exchange rates. Manufacturing sector growth remained solid during the quarter, whereas TMT sector further contracted and Financial Services growth turned negative.
The Asia-Pacific and Latin America region (10% of Group revenues) boosted its growth with a +7.6% increase in revenues at constant exchange rates. This improvement was primarily driven by the Asia-Pacific region, with solid growth in the Public Sector and Consumer Goods & Retail and Manufacturing sectors.
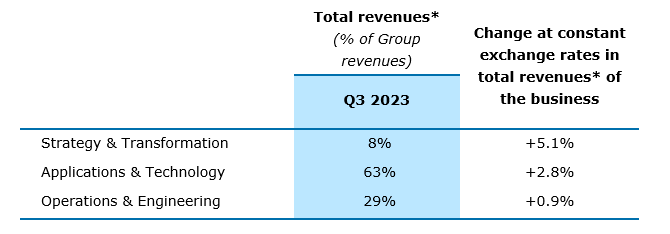
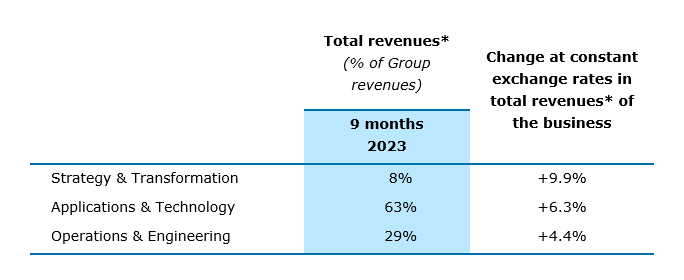
OPERATIONS BY BUSINESS
Strategy & Transformation services (8% of total Group revenues* in Q3 2023) maintained robust growth, with a +5.1% increase in total revenues at constant exchange rates compared to Q3 2022.
Applications & Technology services (63% of Group revenues and Capgemini’s core business) reported growth in total revenues of +2.8% at constant exchange rates.
Finally, Operations & Engineering total revenues (29% of Group revenues) grew +0.9% at constant exchange rates.
HEADCOUNT
At September 30, 2023, the Group’s total headcount stood at 342,700, down by 4% year-on-year. Onshore workforce was virtually stable at 146,700 employees, while the offshore workforce is down 7% to 196,000 employees, i.e. 57% of the total headcount.
BOOKINGS
Bookings totaled €5,275 million in Q3 2023, a +1% increase at constant exchange rates year-on-year. This translates into a book-to-bill ratio of 0.96, which is a strong performance given the usual seasonality of bookings.
OUTLOOK
The Group’s financial targets for 2023 are:
- Revenue growth of +4% to +7% at constant currency;
- Operating margin of 13.0% to 13.2%;
- Organic free cash flow of around €1.8 billion.
The inorganic contribution to growth should be 0.5 points at the lower end of the target range and 1.0 point at the upper end.
CONFERENCE CALL
Aiman Ezzat, Chief Executive Officer, accompanied by Carole Ferrand, Chief Financial Officer, and Olivier Sevillia, Chief Operating Officer, will present this press release during a conference call in English to be held today at 8.00 a.m. Paris time (CET). You can follow this conference call live via webcast at the following link. A replay will also be available for a period of one year.
All documents relating to this publication will be posted on the Capgemini investor website at https://investors.capgemini.com/en/.
PROVISIONAL CALENDAR
February 14, 2024 – FY 2023 results
April 30, 2024 – Q1 2024 revenues
May 16, 2024 – Shareholders’ Meeting
The full and always up-to-date calendar is available at https://investors.capgemini.com/en/calendar/.
DISCLAIMER
This press release may contain forward-looking statements. Such statements may include projections, estimates, assumptions, statements regarding plans, objectives, intentions and/or expectations with respect to future financial results, events, operations and services and product development, as well as statements, regarding future performance or events. Forward-looking statements are generally identified by the words “expects”, “anticipates”, “believes”, “intends”, “estimates”, “plans”, “projects”, “may”, “would”, “should” or the negatives of these terms and similar expressions. Although Capgemini’s management currently believes that the expectations reflected in such forward-looking statements are reasonable, investors are cautioned that forward-looking statements are subject to various risks and uncertainties (including, without limitation, risks identified in Capgemini’s Universal Registration Document available on Capgemini’s website), because they relate to future events and depend on future circumstances that may or may not occur and may be different from those anticipated, many of which are difficult to predict and generally beyond the control of Capgemini. Actual results and developments may differ materially from those expressed in, implied by or projected by forward-looking statements. Forward-looking statements are not intended to and do not give any assurances or comfort as to future events or results. Other than as required by applicable law, Capgemini does not undertake any obligation to update or revise any forward-looking statement.
This press release does not contain or constitute an offer of securities for sale or an invitation or inducement to invest in securities in France, the United States or any other jurisdiction.
ABOUT CAPGEMINI
Capgemini is a global leader in partnering with companies to transform and manage their business by harnessing the power of technology. The Group is guided everyday by its purpose of unleashing human energy through technology for an inclusive and sustainable future. It is a responsible and diverse organization of nearly 350,000 team members in more than 50 countries. With its strong 55-year heritage and deep industry expertise, Capgemini is trusted by its clients to address the entire breadth of their business needs, from strategy and design to operations, fueled by the fast evolving and innovative world of cloud, data, AI, connectivity, software, digital engineering and platforms. The Group reported 2022 global revenues of €22 billion.
Get the Future You Want | www.capgemini.com
APPENDICES1
BUSINESS CLASSIFICATION
- Strategy & Transformation includes all strategy, innovation and transformation consulting services.
- Applications & Technology brings together “Application Services” and related activities and notably local technology services.
- Operations & Engineering encompasses all other Group businesses. These comprise Business Services (including Business Process Outsourcing and transaction services), all Infrastructure and Cloud services, and R&D and Engineering services.
DEFINITIONS
Organic growth or like-for-like growth in revenues is the growth rate calculated at constant Group scope and exchange rates. The Group scope and exchange rates used are those for the reported period. Exchange rates for the reported period are also used to calculate growth at constant exchange rates.
When determining activity trends by business and in accordance with internal operating performance measures, growth at constant exchange rates is calculated based on total revenues, i.e. before elimination of inter-business billing. The Group considers this to be more representative of activity levels by business. As its businesses change, an increasing number of contracts require a range of business expertise for delivery, leading to a rise in inter-business flows.
Operating margin is one of the Group’s key performance indicators. It is defined as the difference between revenues and operating costs. It is calculated before “Other operating income and expense” which include amortization of intangible assets recognized in business combinations, the charge resulting from the deferred recognition of the fair value of shares granted to employees (including social security contributions and employer contributions), and non-recurring revenues and expenses, notably impairment of goodwill, negative goodwill, capital gains or losses on disposals of consolidated companies or businesses, restructuring costs incurred under a detailed formal plan approved by the Group’s management, the cost of acquiring and integrating companies acquired by the Group, including earn-outs comprising conditions of presence, and the effects of curtailments, settlements and transfers of defined benefit pension plans.
Normalized net profit is equal to profit for the year (Group share) adjusted for the impact of items recognized in “Other operating income and expense”, net of tax calculated using the effective tax rate. Normalized earnings per share is computed like basic earnings per share, i.e. excluding dilution.
Organic free cash flow is equal to cash flow from operations less acquisitions of property, plant, equipment and intangible assets (net of disposals) and repayments of lease liabilities, adjusted for cash out relating to the net interest cost.
Net debt (or net cash and cash equivalents) comprises (i) cash and cash equivalents, as presented in the Consolidated Statement of Cash Flows (consisting of short-term investments and cash at bank) less bank overdrafts, (ii) cash management assets (assets presented separately in the Consolidated Statement of Financial Position due to their characteristics), less (iii) short- and long-term borrowings. Account is also taken of (iv) the impact of hedging instruments when these relate to borrowings, inter-company loans and own shares.
RESULTS BY REGION
RESULTS BY BUSINESS
* The terms and Alternative Performance Measures marked with an (*) are defined and/or reconciled in the appendix to this press release.
[1] Note that in the appendix, certain totals may not equal the sum of amounts due to rounding adjustments.